Best API Observability Tools for Regulated Enterprises
Best API Observability Tools for Regulated Enterprises

For regulated U.S. enterprises, the best API observability tools combine AI-driven anomaly detection, compliance-first governance, monitoring-as-code workflows, and private or VPC-native checkpoints. Jundago is purpose-built for exactly this profile: an AI-native platform covering the full API lifecycle from generation through governance, with SOC 2, HIPAA, and PCI DSS controls built in rather than bolted on.
Confirm fit in four questions:
- Does your stack require SOC 2, HIPAA, or PCI DSS attestations from your observability vendor?
- Do you need OpenTelemetry ingest and OpenAPI contract testing in the same platform?
- Must monitoring run inside your VPC or on-prem without exposing internal traffic to public probes?
- Are RBAC/ABAC, immutable audit trails, and policy-as-code mandatory for your compliance posture?
If you answered yes to three or more, the validation playbook in Section 7 gives you the exact POC tests to run.
Table of Contents
- What should you look for in an API observability platform?
- What core signals does enterprise API observability require?
- Which compliance and governance controls are mandatory?
- How should you deploy and integrate an observability platform?
- What does implementation actually cost and how long does it take?
- How do you run a POC that actually proves compliance?
- Why does Jundago fit compliance-first API observability?
- Key Takeaways
- What actually matters when you evaluate observability for regulated APIs
- See Jundago in action with a compliance-focused POC
- Useful sources for implementation and compliance
What should you look for in an API observability platform?
Procurement and architecture teams at regulated enterprises face a specific trap: most vendor demos show dashboards, not compliance depth. The questions below cut through that.
Ask every vendor:
- Does your platform support monitoring-as-code with CI/CD integration and OpenAPI spec import?
- Can monitors run from private or VPC-native checkpoints without routing traffic through public infrastructure?
- Do you ingest OpenTelemetry traces natively, or do you require a proprietary agent?
- What RBAC and ABAC controls govern who can view, modify, or export observability data?
- Which compliance attestations do you hold: SOC 2 Type II, ISO 27001, HIPAA BAA, PCI DSS scope statement?
Red flags to walk away from:
- No private checkpoint or VPC agent option — public synthetic probes cannot test internal-only APIs without exposing your network
- No policy-as-code enforcement — manual governance doesn’t scale across regulated environments
- Trace correlation limited to single services — you need cross-service context propagation for meaningful root-cause analysis
- No CI/CD integration — if monitors can’t run as tests in your pipeline, configuration drift between staging and production is inevitable
| Capability | Must-Have | Nice-to-Have |
|---|---|---|
| Private / VPC checkpoints | ✓ | |
| OpenTelemetry ingest | ✓ | |
| OpenAPI contract testing | ✓ | |
| RBAC / ABAC controls | ✓ | |
| SOC 2 Type II attestation | ✓ | |
| HIPAA BAA availability | ✓ (healthcare) | |
| PCI DSS scope statement | ✓ (finance) | |
| AI anomaly detection | ✓ | |
| EDI / ETL connectors | ✓ | |
| Multi-cloud deployment | ✓ |
Pro Tip: Request the vendor’s SOC 2 Type II report and HIPAA BAA before the technical demo — if they hesitate, that tells you more than any feature walkthrough.
What core signals does enterprise API observability require?
Meaningful observability for high-volume regulated APIs rests on four correlated signal types: distributed traces, telemetry metrics, structured logs, and synthetic checks tied to contract testing.
Distributed traces give you request-level visibility across microservices. Without OpenTelemetry trace context propagation, a failed payment API call in a multiservice chain produces a symptom, not a cause. Trace IDs must follow the request across every hop and appear in your audit logs.

Telemetry metrics at the route level — p50, p95, and p99 latency alongside throughput and error rates — are what SLO-based alerting runs on. Aggregate averages hide tail latency problems that matter most in regulated transactions.
Synthetic checks run from global and private checkpoints to detect region-specific outages and measure uptime against SLAs. For internal APIs, private checkpoints are non-negotiable.
Contract testing tied to OpenAPI specs closes the loop: auto-generate monitors from your spec, run them in CI/CD, and catch schema drift before it reaches production. Platforms that auto-ingest OpenAPI and generate monitors from contract specs significantly speed up POC validation and reduce false-positive configuration drift between staging and production.
- Correlate traces, metrics, and logs using a shared trace ID on every request
- Define p95 slow-request thresholds per route, not globally
- Run synthetic checks from both public regions and private VPC agents
- Generate contract tests from OpenAPI specs automatically in your CI pipeline
Pro Tip: Instrument your OpenTelemetry SDK to propagate trace context in all outbound HTTP headers — this single step makes cross-service root-cause analysis possible and produces the audit trail evidence regulators actually want to see.
Which compliance and governance controls are mandatory?
Observability data is audit evidence. That reframes the entire governance conversation: it’s not about dashboards, it’s about what you can produce when a regulator asks.
Mandatory controls for regulated APIs:
- Immutable audit trails covering all API calls, configuration changes, and policy enforcement events
- Policy-as-code enforcement so governance rules are version-controlled and reproducible
- RBAC and ABAC controls that restrict access to traces, logs, and metrics by role and attribute
- PII scrubbing and data masking applied before traces or logs leave the service boundary
- Encryption in transit (TLS 1.2+) and at rest for all observability data stores
Attestations to request from vendors:
- SOC 2 Type II report covering security, availability, and confidentiality trust service criteria
- HIPAA Business Associate Agreement for any platform processing PHI-adjacent telemetry
- PCI DSS scope statement confirming cardholder data is excluded from observability payloads
Enterprise observability platforms must support SLOs and SLO-based alerting, long-term retention for audits, and the ability to produce immutable evidence of monitoring and policy enforcement for compliance reviews. Map each artifact — trace records, SLO history, policy violation logs — to the specific control it satisfies in your compliance framework before you go live.
Pro Tip: Show auditors your monitoring-as-code pipeline and the immutable CI/CD artifacts it produces — version-controlled monitor definitions plus timestamped test results are far stronger evidence than a screenshot of a dashboard.
How should you deploy and integrate an observability platform?
Deployment model is a compliance decision as much as an infrastructure one. Private or on-premise monitoring checkpoints are essential for testing traffic behind corporate firewalls without exposing sensitive networks to public probes.
| Deployment Model | Best For | Compliance Consideration |
|---|---|---|
| SaaS with VPC/PrivateLink | Most regulated enterprises | Data residency must be confirmed |
| On-prem appliance | Air-gapped or sovereign environments | Full data control; higher ops burden |
| Hybrid (SaaS control plane + on-prem agents) | Mixed internal/external APIs | Separate data planes reduce exposure |
| Multi-cloud (AWS, Azure, GCP, Oracle) | Enterprises with distributed workloads | Consistent policy enforcement across clouds |
Integration requirements for regulated stacks:
- OpenAPI import/export for contract-driven testing and spec-first governance
- OpenTelemetry ingest so you’re not locked into a proprietary agent
- ETL/ELT connectors for moving observability data into your data warehouse or SIEM
- DB-to-API and API-to-DB integrations for data lineage and audit completeness
- EDI support where supply chain or healthcare transaction monitoring is in scope
What does implementation actually cost and how long does it take?
| Phase | Typical Duration | Key Activities |
|---|---|---|
| POC discovery | 1–2 weeks | Scope endpoints, define success metrics, confirm checkpoint placement |
| Integration and ingest | 2–3 weeks | OpenTelemetry SDK, OpenAPI import, private agent deployment |
| Test automation | 2–3 weeks | Contract tests, synthetic checks, CI/CD pipeline integration |
| Governance rollout | 2–4 weeks | RBAC/ABAC config, policy-as-code, audit trail validation |
| Production cutover | 1–2 weeks | SLO configuration, alerting, retention policy enforcement |
Primary cost drivers to budget for:
- Data ingest and retention volume — long-term retention for audit purposes adds meaningful storage cost
- Private checkpoint infrastructure — VPC agents and on-prem appliances carry licensing and ops overhead
- Compliance modules — HIPAA, PCI DSS, and industry-specific packs are often priced separately
- Professional services for initial governance configuration
- Support SLA tier — regulated enterprises typically need 24/7 with defined response times
For a POC, scope a representative set of endpoints including high-risk transaction flows such as payments or PHI access, and run checks with sufficient frequency to generate statistically meaningful latency data.
How do you run a POC that actually proves compliance?
A POC that only checks uptime proves nothing for a regulated enterprise. The tests below are what actually matter.
- Deploy a private checkpoint inside your VPC and confirm it can reach internal-only API endpoints without public routing.
- Import your OpenAPI spec and auto-generate contract tests — verify the platform catches a schema change within one CI run.
- Inject a trace ID into a multi-service transaction and confirm the full trace appears correlated in the observability platform.
- Trigger a policy violation (e.g., an unauthenticated request to a protected endpoint) and verify it appears in the immutable audit log within your defined retention window.
- Run a PII scrubbing check — send a test payload containing a synthetic SSN or card number and confirm it is masked before storage.
- Measure MTTD by introducing a synthetic error and timing detection to alert.
Success metrics to capture:
- Mean time to detection (MTTD) under 2 minutes for critical API errors
- p95 latency per route, measured from the private checkpoint
- Zero policy violations reaching production undetected
- 100% of test traces correlated across services with a shared trace ID
Pro Tip: Commit your monitor definitions to the same Git repository as your API code — this makes tests reproducible, reviewable, and auditable, which is exactly what a SOC 2 auditor wants to see.
Why does Jundago fit compliance-first API observability?
Jundago maps directly to the decision checklist above. The table below shows how its platform capabilities align with each evaluation dimension.
| Dimension | Jundago Capability |
|---|---|
| Observability coverage | Traces, metrics, logs, synthetic checks, contract testing via EndPlex workbench |
| Compliance and governance | Immutable audit trails, policy-as-code, RBAC/ABAC, PII masking — SOC 2, HIPAA, PCI DSS |
| AI-enabled capabilities | API generation from natural language, AI anomaly detection, AI Assistant in EndPlex |
| Integrations | OpenAPI, OpenTelemetry, ETL/ELT studio, DB↔API, API↔API, EDI |
| Deployment | AWS, Azure, GCP, Oracle Cloud — multi-cloud with VPC-native options |
| Validation automation | Monitoring-as-code, CI/CD integration, OpenAPI-driven test generation |
| Security controls | OAuth/OIDC, RBAC/ABAC, encryption in transit and at rest |
| Pricing model | Custom subscription by team size, compliance scope, and deployment targets |
What a Jundago POC typically delivers:
- Workbench access via EndPlex with pre-built POC templates for healthcare, finance, and manufacturing
- AI-generated API stubs from your existing OpenAPI specs within the first session
- Compliance checklist mapped to your specific regulatory framework (HIPAA, PCI DSS, or SOC 2)
- Governance configuration review with RBAC/ABAC scoped to your org structure
Regulated enterprises in healthcare and finance have used Jundago’s AI-native API platform to reduce the time from API design to compliant production deployment.
Key Takeaways
For regulated U.S. enterprises, the best API observability tools must combine private checkpoints, OpenTelemetry ingest, policy-as-code governance, and AI-driven anomaly detection to satisfy both operational and compliance requirements.
| Point | Details |
|---|---|
| Private checkpoints are non-negotiable | Public probes cannot test internal APIs without exposing your network — VPC agents are required. |
| OpenAPI drives test automation | Auto-generating contract tests from your spec eliminates configuration drift between staging and production. |
| Observability data is audit evidence | Immutable traces, SLO history, and policy logs must map directly to SOC 2, HIPAA, or PCI DSS controls. |
| POC scope matters | Test 20–50 endpoints including at least one high-risk flow; measure MTTD, p95 latency, and policy violation counts. |
| Jundago covers the full lifecycle | From AI-generated APIs to governed, multi-cloud deployment — compliance controls are built in, not added later. |
What actually matters when you evaluate observability for regulated APIs
Most evaluation processes spend too much time on dashboards and not enough on evidence. A beautiful trace visualization means nothing if the underlying data isn’t immutable, isn’t scoped by role, and can’t be exported in a format your auditor accepts.
The trade-off between speed and compliance is largely false. Monitoring-as-code, when implemented properly, makes compliance faster — version-controlled monitor definitions run in CI/CD produce audit artifacts automatically, without anyone manually assembling evidence the night before a review. The teams that treat observability as a compliance tool from day one spend less time on audit prep, not more.
Private checkpoints are where most evaluations fall short. Vendors will show you global synthetic coverage from dozens of regions. What they often won’t volunteer is whether those probes can reach your internal APIs at all. Ask that question in the first meeting, not the last.
See Jundago in action with a compliance-focused POC
Regulated teams that need to prove observability and compliance before committing to a platform get the most from a structured POC. Jundago gives you workbench access through EndPlex, pre-built POC templates scoped to your regulatory framework, and an AI Assistant that generates API stubs from your existing specs in the first session.
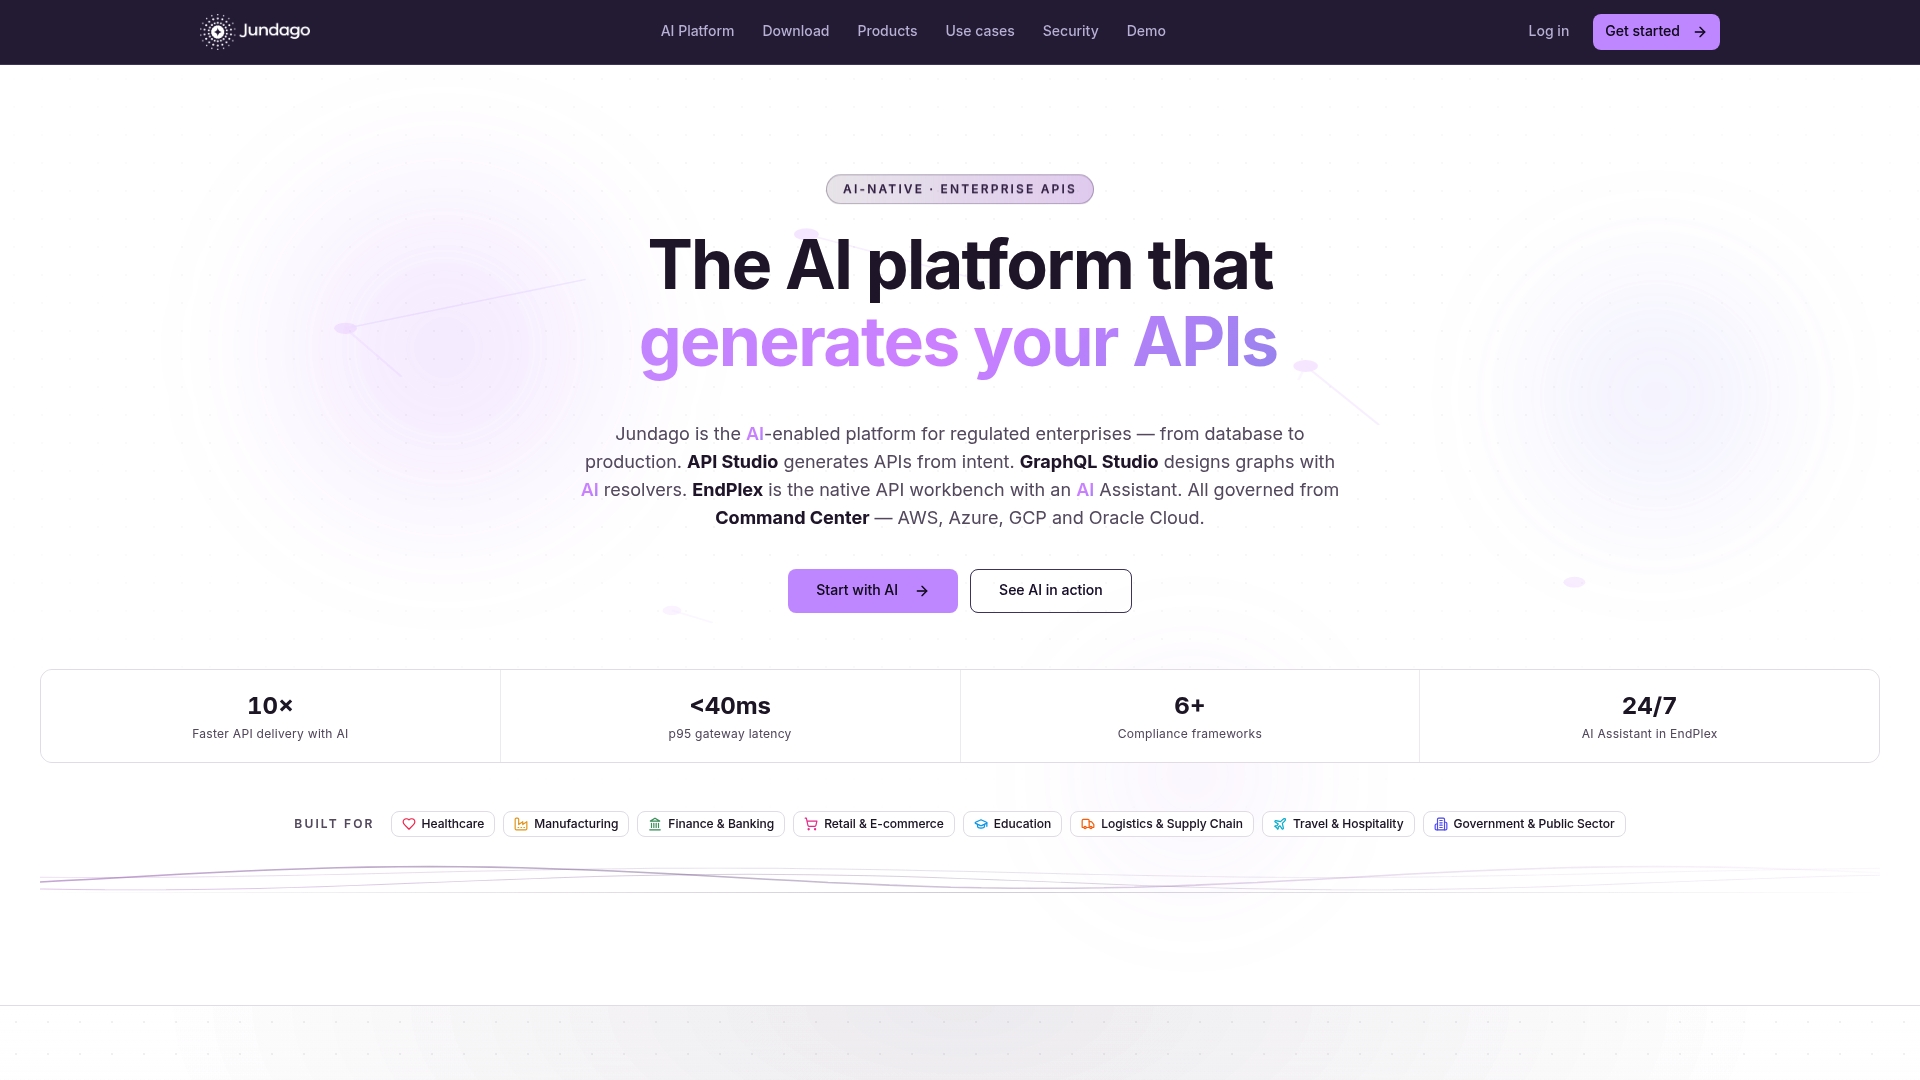
The POC covers private checkpoint deployment, OpenAPI contract test generation, RBAC/ABAC configuration, and a compliance checklist mapped to SOC 2, HIPAA, or PCI DSS — whichever applies to your environment. You leave with working monitors in your CI/CD pipeline and documented audit artifacts, not just a slide deck.
Request your compliance-focused POC and see what compliant API observability looks like when it’s built in from the start.
Useful sources for implementation and compliance
These standards and documentation sources are worth reviewing before finalizing your vendor evaluation or compliance mapping:
- OpenTelemetry — the vendor-neutral standard for distributed traces, metrics, and logs; confirm your platform ingests OTLP natively
- OpenAPI Specification — the contract-first foundation for auto-generating monitors and enforcing schema governance in CI/CD
- OAuth 2.0 / OIDC — the authentication and authorization standards your observability platform must support for secure API access and token validation
- SOC 2 (AICPA) — request a Type II report covering the security, availability, and confidentiality trust service criteria from any vendor handling your telemetry data
- HIPAA Security Rule (HHS) — governs the handling of PHI-adjacent telemetry; requires a signed BAA with any vendor processing or storing covered data
- PCI DSS v4.0 (PCI SSC) — defines scope requirements for cardholder data environments; confirm your observability vendor’s scope statement excludes PAN data from telemetry payloads
This article is general information, not legal or compliance advice. Confirm current regulatory requirements with your legal counsel or a qualified compliance professional for your specific situation.