Best API Monitoring Tools for Developers in 2026
Best API Monitoring Tools for Developers in 2026

For most engineering teams, a hybrid approach combining synthetic checks with request-level observability is the right starting point. Synthetics catch outages before users do; observability gives you the forensic context to understand why something broke. Neither alone is enough.
TL;DR:
- Prioritize uptime checks, payload assertions, and P95/P99 latency from day one — average latency hides the tail-end experience that actually breaks SLAs.
- Budget rule of thumb: multiply your monitor count by check frequency by retention window; that product drives cost across almost every pricing model.
- Mask PII at capture, not after — especially if PCI DSS, HIPAA, or similar compliance frameworks apply to your stack.
- Jundago covers the full API lifecycle for regulated enterprises, with built-in compliance controls and CI/CD-ready monitoring integration.
Table of Contents
- What is API monitoring and how does it differ from logging?
- Which API metrics should every team monitor?
- API logging vs. monitoring vs. observability — when do you need each?
- What real-time monitoring features should you expect from modern tools?
- Short profiles of the best API monitoring tools for 2026
- How do you choose the right API monitoring tool?
- How to integrate API monitors into your CI/CD pipeline
- What does API monitoring actually cost?
- Key Takeaways
- The monitoring gap most teams discover too late
- Jundago is built for the API monitoring problems that matter most in regulated industries
- Useful sources and further reading
What is API monitoring and how does it differ from logging?
API monitoring tracks the health, availability, and behavior of your APIs in real time. At its core, it answers: is the API up, is it responding within acceptable latency, and is it returning the right data? That last question is where most teams underinvest.
Monitoring vs. logging vs. observability serve different jobs:
- Monitoring (synthetic + assertion-driven): proactive checks that fire on a schedule or trigger, alerting you before users complain. Best for uptime, latency thresholds, and functional assertions.
- Logging: a record of what happened. Logs are reactive — you query them after something goes wrong. They supply detail but not detection.
- Observability: request-level context, distributed traces, and structured telemetry that let you ask arbitrary questions about system behavior. Observability is what you reach for when monitoring tells you something is wrong but not why.
The practical gap: synthetics miss low-frequency failures that only appear under real traffic. Observability misses outages entirely when traffic volume drops to zero. You need both.
API types and how monitoring needs shift:
- REST: standard HTTP status codes plus JSON payload assertions; most tools handle this natively.
- GraphQL: always a POST to a single endpoint, so status-code-only checks are nearly useless. JSONPath assertions on the response body are required to verify query results.
- gRPC: binary protocol; requires tools that decode protobuf or operate at the application layer.
- SOAP: XML payloads; keyword and XPath assertions matter more than JSON checks.
Common collection methods and their trade-offs:
- Synthetic checks: scheduled probes from external nodes. Fast to set up, no code changes, but only test what you explicitly script.
- SDK-based capture: instrument your service to emit telemetry. Enables 100% traffic capture and masking at the source, but requires code changes and adds a dependency.
- Network mirroring: passively captures traffic at the infrastructure layer. No code changes, but can expose raw payloads to third-party systems — a compliance risk in regulated environments.
Which API metrics should every team monitor?
Availability and error rate are table stakes. The metrics that actually separate a well-instrumented API from a poorly instrumented one are latency percentiles and payload validation.
Primary metrics to track:
- Availability/uptime: percentage of successful checks over a rolling window; maps directly to SLA commitments.
- Error rate: ratio of 4xx/5xx responses to total requests; a sudden spike here is usually the first signal of a real problem.
- Throughput (RPS): requests per second; a drop in throughput can indicate upstream failures or traffic routing issues.
- Latency percentiles (P50/P95/P99): P99 tail latency is what your slowest 1% of users experience. SLA breaches almost always show up in P95/P99 before they appear in averages.
- Time to first byte (TTFB): isolates server processing time from network transfer; useful for diagnosing slow backends.
- Payload validation: confirms the response body contains expected fields and values, not just a 200 status. A 200 OK does not guarantee the API is actually working — a broken auth flow or empty data array can return 200 just fine.
| Metric | Why it matters | Typical alert threshold |
|---|---|---|
| Availability | Drives SLA calculations and incident severity | Below a high-availability threshold over a rolling hour |
| P99 latency | Exposes tail-user experience; SLA breaches show here first | Exceeds multiple times your baseline latency |
| Error rate | First signal of functional regressions or upstream failures | Above a low single-digit error rate sustained over several minutes |
| Throughput (RPS) | Sudden drops indicate routing or upstream failures | Drops significantly below your rolling weekly baseline |
| Payload assertion pass rate | Catches functional regressions a status code never would | Any failure on a critical endpoint |
| TTFB | Isolates server-side latency from network | Exceeds agreed SLA response budget |
For synthetic checks, availability and TTFB are natural fits. Payload assertions and percentile analytics require either real-traffic capture or scripted synthetic flows that mimic realistic request bodies.
API logging vs. monitoring vs. observability — when do you need each?
Think of these three as layers, not alternatives. The mistake is treating them as interchangeable.
Logging is your audit trail. It tells you what requests came in, what responses went out, and what errors were thrown. Logs are indispensable for compliance and forensics, but they are passive — you have to know what to look for before they help you.
Monitoring is your early-warning system. Synthetic checks run on a schedule and fire alerts when thresholds are crossed. For early-stage teams, starting with basic uptime checks and a few payload assertions covers most failure modes without significant operational overhead.
Observability is what you need when your system is distributed, high-throughput, or exhibiting failures that only appear under specific conditions. Request traces, span data, and structured context let you reconstruct exactly what happened across service boundaries. Full request-and-response capture gives you forensic detail but increases storage costs and compliance exposure — masking at capture is the mitigation.
When to prioritize each:
- Early-stage or small team: start with synthetic monitoring and a handful of payload assertions on critical endpoints.
- Growing team with real traffic: add SDK-based observability to capture real-user behavior and catch regressions synthetics miss.
- Distributed or microservices architecture: distributed tracing becomes necessary; you cannot debug cross-service latency with logs alone.
The blind spot to avoid: teams that rely only on synthetics miss sporadic failures that only occur under real load patterns. Teams that rely only on observability miss outages that happen when traffic is near zero — a scheduled job that stops running, for example.
What real-time monitoring features should you expect from modern tools?
Production APIs need more than a ping every five minutes. Here is the feature checklist worth running against any tool you evaluate:
- Global synthetic nodes: checks from multiple geographic regions so you catch routing and CDN issues that only affect specific markets.
- Multi-region latency comparison: percentile analytics that let you compare P95/P99 across US East vs. Singapore and adjust routing or caching accordingly.
- Payload assertions: JSONPath checks, keyword presence/absence, and schema validation — not just status codes.
- Per-stage timing breakdown: DNS, TCP, TLS, and TTFB captured per check so you can pinpoint exactly where latency is accumulating.
- Distributed tracing: span-level context for requests that cross service boundaries.
- Sampling strategy controls: ability to set sampling rates per endpoint or environment, with 100% capture available for critical paths.
- Real-time alerting integrations: PagerDuty, Slack, and webhook support are table stakes; look for alert deduplication and consecutive-failure thresholds to reduce noise.
- CI/CD hooks: monitor creation from OpenAPI specs and the ability to run monitors as pre-deploy tests.
- Export hooks: Prometheus/Grafana-compatible metrics export or BigQuery integration for long-term analytics.
On security: SDK-based masking strips sensitive fields before telemetry leaves your infrastructure. Network-level mirroring captures raw payloads, which can expose PII or PHI to third-party platforms. For any environment subject to HIPAA, PCI DSS, or similar frameworks, SDK-based collection with masking at capture is the safer architecture.
Pro Tip: Set up anomaly detection and health scoring on your most critical endpoints. Tools that surface degradation before full downtime — rather than alerting only on binary up/down — give you a meaningful head start on incident response.

Short profiles of the best API monitoring tools for 2026
These profiles are meant to help you shortlist, not rank. Match the tool’s strengths to your constraints.
Prometheus
Best for: metric collection in Kubernetes and containerized environments. Prometheus is a pull-based, open-source time-series database that scrapes metrics from instrumented services on a configurable interval. It does not do synthetic checks or distributed tracing natively, but it is the de facto standard for infrastructure and application metrics in cloud-native stacks.
- Pricing: open-source, self-hosted; operational costs depend on your infrastructure.
- Protocols: works at the metrics layer; protocol-agnostic once instrumented.
- Pros: massive ecosystem, flexible PromQL query language, native Kubernetes integration.
- Cons: no built-in alerting UI, no synthetic monitoring, retention at scale requires additional tooling (Thanos, Cortex).
Grafana
Best for: visualization and dashboarding across multiple data sources. Grafana connects to Prometheus, Loki, Tempo, and dozens of other backends to give you a unified view of metrics, logs, and traces. Grafana Cloud adds managed hosting and some synthetic monitoring capabilities.
- Pricing: open-source core; Grafana Cloud has a free tier and paid plans.
- Protocols: data-source agnostic; visualizes whatever your backends collect.
- Pros: best-in-class dashboards, strong community, multi-datasource correlation.
- Cons: not a monitoring tool on its own — it visualizes data collected elsewhere; alert management can get complex at scale.
Moesif
Best for: API analytics and developer experience monitoring. Moesif captures real API traffic, segments it by user or company, and surfaces behavioral analytics — who is calling what, with what payloads, and how usage patterns change over time. Strong fit for API-first products tracking developer adoption.
- Pricing: usage-based; free tier available.
- Protocols: REST and GraphQL natively.
- Pros: deep user-level analytics, funnel tracking, behavioral segmentation.
- Cons: less focused on synthetic uptime checks; not the right tool if your primary need is proactive outage detection.
Datadog
Best for: teams that want a single platform for APM, infrastructure monitoring, logs, and synthetics. Datadog’s API monitoring sits inside a broader observability platform, which means you get correlated traces, logs, and metrics in one place. G2 reviewers consistently highlight its integrations and dashboard depth.
- Pricing: subscription, usage-based; costs scale with hosts, custom metrics, and log volume.
- Protocols: REST, GraphQL, gRPC via APM instrumentation.
- Pros: unified platform, strong CI/CD integrations, excellent alerting.
- Cons: pricing can escalate quickly at high log volumes; steep learning curve for new teams.
Checkly
Best for: developer-centric synthetic monitoring with a monitoring-as-code workflow. Checkly lets you write API checks in JavaScript, generate monitors from OpenAPI specs, and run them as tests in CI before deployment. The monitoring-as-code approach means monitors live in your repo alongside your code.
- Pricing: subscription per check; free tier available.
- Protocols: REST and GraphQL (via POST with query bodies).
- Pros: excellent CI/CD integration, OpenAPI-driven monitor creation, strong assertion support.
- Cons: primarily synthetic; real-traffic observability requires a separate tool.
Sematext
Best for: teams that want logs, metrics, and synthetic monitoring without the Datadog price tag. Sematext offers both cloud and on-premises deployment, which matters for teams with data residency requirements.
- Pricing: subscription; separate plans for logs and monitoring.
- Protocols: REST; broader protocol support via agents.
- Pros: competitive pricing, on-prem option, solid log management.
- Cons: smaller ecosystem than Datadog or New Relic; UI is functional but not as polished.
Papertrail
Best for: log aggregation and search for teams that need fast, searchable log tailing without a complex setup. Papertrail is a managed log management service — not a full API monitoring platform, but a strong complement to synthetic tools when you need quick log search during incidents.
- Pricing: subscription, usage-based on log volume.
- Protocols: syslog, HTTP; log-level, not protocol-aware.
- Pros: extremely fast to set up, real-time log tailing, good search.
- Cons: logs only — no metrics, no synthetics, no tracing.
New Relic
Best for: full-stack observability with a generous free tier. New Relic’s unified data platform ingests metrics, logs, traces, and synthetic checks. G2 reviewers note its breadth and the value of its free tier for smaller teams.
- Pricing: consumption-based; 100 GB/month free, then per-GB.
- Protocols: REST, GraphQL, gRPC via APM agents.
- Pros: broad protocol support, strong free tier, unified telemetry platform.
- Cons: consumption pricing can surprise teams with high-volume APIs; query language (NRQL) has a learning curve.
Splunk
Best for: enterprise log management and security analytics at scale. Splunk’s strength is in ingesting massive log volumes, running complex searches, and feeding security and compliance workflows. G2 enterprise reviewers cite its power for compliance reporting and SIEM use cases.
- Pricing: volume-based licensing; enterprise contracts.
- Protocols: log and event data; API monitoring via HTTP Event Collector and add-ons.
- Pros: unmatched log search power, strong compliance and audit features, large ecosystem.
- Cons: expensive at scale, operationally heavy, not purpose-built for API synthetic monitoring.
Honeycomb
Best for: high-cardinality observability in distributed systems. Honeycomb stores every event with full context and lets you slice and dice across any dimension without pre-aggregating. It is the tool of choice for teams debugging complex, intermittent failures that aggregate metrics simply cannot surface.
- Pricing: usage-based; free tier available.
- Protocols: any HTTP-based API via instrumentation; OpenTelemetry-native.
- Pros: best-in-class high-cardinality querying, OpenTelemetry support, fast query performance.
- Cons: no built-in synthetic monitoring; requires instrumentation investment upfront.
Jundago
Best for: regulated enterprises that need API monitoring, generation, testing, and governance in a single AI-native platform. Jundago covers the full API lifecycle — from generating REST, GraphQL, gRPC, and SOAP APIs from natural language intent, through automated testing and load testing, to governance and compliance automation. Built-in RBAC and ABAC controls, SDK-based masking, and industry modules for HIPAA, PCI DSS, and IEC 62443 make it the right fit for healthcare, finance, and manufacturing teams that cannot afford to bolt compliance onto a generic monitoring tool after the fact.
- Pricing: custom subscription; enterprise licensing available.
- Protocols: REST, GraphQL, gRPC, SOAP — all natively.
- Pros: full lifecycle coverage, compliance built in, multi-cloud deployment (AWS, Azure, GCP, Oracle Cloud), CI/CD-ready.
- Cons: designed for regulated enterprise teams; not the right fit for a solo developer running a side project.
Pro Tip: If you are evaluating tools for a regulated environment, ask every vendor specifically how they handle PII masking at capture — not just whether they support masking, but at what layer it happens. SDK-level masking before data leaves your infrastructure is a fundamentally different security posture than masking applied after ingestion.
How do you choose the right API monitoring tool?
Start with your constraints, not the feature list. The tool that fits a fintech team with PCI DSS obligations looks different from the one that fits a startup running three REST endpoints.
Decision criteria to weight:
- Protocol support: does the tool handle your actual API types? GraphQL and gRPC require more than basic HTTP checks.
- Assertion power: can it do JSONPath checks, schema validation, and keyword assertions — or just status codes?
- Collection method: SDK vs. network mirroring vs. synthetic. Each has different compliance implications.
- Multi-region coverage: how many geographic nodes? Can you compare P95/P99 across regions?
- Retention and storage: what is the default retention window for raw events vs. aggregated metrics? Can you extend it?
- CI/CD automation: can monitors be created programmatically from OpenAPI specs and run as pre-deploy tests?
- Security and compliance: PII masking, in-region hosting, RBAC, data-processing agreements.
- Total cost of ownership: licensing plus operational overhead for self-hosted options.
Questions to ask in a vendor demo:
- Can you mask PII at capture, before data leaves our infrastructure?
- How do you create monitors from an OpenAPI spec or CI artifact?
- What are the P95 and P99 retention windows, and what does extending them cost?
- Do you support 100% traffic capture, or is sampling the only option?
- How does alerting handle flapping — consecutive-failure thresholds, deduplication?
- What compliance certifications do you hold (SOC 2, HIPAA BAA, PCI DSS)?
Red flags to watch for:
- No payload assertions — status-code-only checks miss most functional regressions.
- Single-region checks only — you cannot understand global user experience from one location.
- No CI/CD integration — monitors that live outside your deployment pipeline will drift.
- Opaque pricing — tools that require a sales call to get any pricing signal often have costs that scale unpredictably.
- Sampling-only capture when your use case requires forensic completeness.
Scoring rubric suggestion: weight protocol support and assertion power at roughly 25% each (they determine whether the tool can actually monitor your APIs), multi-region coverage and CI/CD integration at 20% each, and security/compliance features at 10% — unless you are in a regulated industry, in which case flip that last weight to 30% and reduce protocol support to 15%.
How to integrate API monitors into your CI/CD pipeline
Getting monitoring right is less about tool selection and more about treating monitors as first-class code artifacts. Here is a practical implementation sequence:
- Instrument synthetic monitors from your OpenAPI spec. Most modern tools can generate a baseline check set from a spec file. Do this at API creation, not after the first outage.
- Add payload assertions to every critical endpoint. At minimum: assert on required fields, data types, and at least one business-logic value. A health-check endpoint that returns
{"status": "ok"}with an empty data array is not healthy. - Run monitors as pre-deploy tests in CI. Wire your monitor suite to run against a staging environment on every pull request. A failing monitor blocks the merge — same as a failing unit test.
- Deploy monitors automatically post-deploy. When a new API version ships, the corresponding monitor version should ship with it. Programmatic monitor creation from specs prevents the drift that happens when monitors are managed manually.
- Configure multi-region checks for production. At minimum, cover your primary user geographies. Compare P95/P99 across regions weekly to catch routing regressions before they compound.
- Set P95/P99 latency alerts, not just average latency alerts. Average latency can look fine while your slowest 1% of users are timing out.
- Integrate with your incident tooling. PagerDuty, Slack, or whatever your on-call rotation uses — alerts that go nowhere are worse than no alerts because they train teams to ignore them.
- Scrub sensitive data at capture. If your APIs handle PII, PHI, or payment data, configure masking before telemetry is emitted. Do not rely on post-ingestion redaction.
Common pitfalls:
- Treating monitors as static — APIs evolve and assertions go stale. Version your monitors alongside your API versions.
- Noisy alerts from single-failure thresholds — require two or three consecutive failures before paging someone at 2 AM.
- Skipping payload assertions on “internal” APIs — internal APIs break in exactly the same ways external ones do.
Pro Tip: Require a passing monitor for your primary health-check endpoint as a merge gate in your CI pipeline. It takes about 20 minutes to set up and catches a surprising number of regressions that unit tests miss because they test behavior under real network conditions, not mocked ones.
A practical CI pattern: on every PR, your pipeline fetches the OpenAPI spec artifact, generates or updates the corresponding monitor set, runs checks against the staging deployment, and fails the build if any assertion fails. No vendor-specific scripts required — this is a webhook call and a status check.

What does API monitoring actually cost?
Pricing models vary enough that a tool cheap at 10 monitors can be expensive at 500. Understanding the cost drivers matters more than comparing list prices.
Common pricing shapes:
- Open-source self-hosted (Prometheus, Grafana core): no licensing cost, but you pay for infrastructure, storage, and engineering time to operate it. For small teams, this is often cheaper. For large teams, the operational overhead adds up fast.
- Per-monitor subscription: a fixed monthly fee per active monitor or check. Predictable, but can get expensive as your API surface grows.
- Usage-based (checks per month, data ingested, events stored): scales with actual usage, which is good for variable workloads but hard to budget for.
- Enterprise custom: negotiated contracts with retention tiers, SLA commitments, and dedicated support. Standard for Splunk, Datadog at scale, and Jundago.
Rules of thumb for budgeting:
- Estimate your cost as: number of monitors × check frequency × retention window. Doubling check frequency roughly doubles cost on usage-based plans.
- Synthetic checks are cheap per execution; real-traffic capture at 100% volume is expensive at scale. Use 100% capture for critical paths and sample everything else.
- Move raw logs to cheaper long-term storage (S3, GCS) after 7–30 days; keep only recent windows in fast-lookup storage.
- Set longer check intervals (5–10 minutes) for non-critical or internal endpoints; reserve 30-second checks for customer-facing SLA-bound APIs.
Procurement considerations for regulated enterprises:
- Require contractual SLAs and data-processing agreements (DPAs) before signing.
- Confirm in-region or on-premises hosting options if data residency is a compliance requirement.
- Ask about audit log access and retention — some compliance frameworks require you to retain monitoring data for 12 months or longer.
Key Takeaways
The most effective API monitoring strategy combines synthetic checks for proactive detection with request-level observability for forensic context, with payload assertions and P95/P99 latency tracking as the highest-value signals in both layers.
| Point | Details |
|---|---|
| Hybrid monitoring wins | Combine synthetic checks with observability; neither alone covers all failure modes. |
| Assert payloads, not just status codes | A 200 OK can mask a broken response; JSONPath assertions catch what status codes miss. |
| Integrate monitors into CI/CD | Version monitors with your API code; a failing monitor should block a deploy like a failing test. |
| Multi-region P95/P99 checks | Average latency hides tail-user experience; compare percentiles across regions for SLA accuracy. |
| Jundago for regulated teams | Jundago covers the full API lifecycle with built-in compliance, SDK-based masking, and RBAC/ABAC for healthcare, finance, and manufacturing. |
The monitoring gap most teams discover too late
The conventional wisdom in API monitoring is to pick a tool, set up some uptime checks, and call it done. That approach works until it doesn’t — and when it fails, it usually fails in the worst possible way: a 200 OK response masking a broken authentication flow, or a latency regression that only shows up in P99 for users in Southeast Asia.
What most articles on this topic underemphasize is the assertion problem. Status-code monitoring is table stakes, but the real value of a monitoring investment shows up in payload assertions and percentile tracking. The teams that catch regressions before users do are almost always the ones who wrote assertions against specific response fields and set alerts on P99 latency, not averages.
The second underemphasized point is the CI/CD integration gap. Monitors that live outside your deployment pipeline will drift. An API changes, the assertion becomes stale, the monitor keeps passing, and you have a false sense of coverage. The fix is not complicated — version your monitors alongside your API code and require a passing monitor as a merge gate — but it requires treating monitoring as an engineering discipline, not an ops afterthought.
For regulated enterprises, there is a third layer that generic monitoring guides almost never address: the compliance architecture of the monitoring tool itself. Where does your telemetry go? Who can see it? Is PII masked before it leaves your infrastructure? These are not nice-to-have questions. They are the questions that determine whether your monitoring setup is compliant or a liability.
Jundago is built for the API monitoring problems that matter most in regulated industries
Most monitoring tools solve the detection problem well. What they leave unsolved is the compliance architecture, the full lifecycle context, and the governance layer that regulated enterprises actually need.
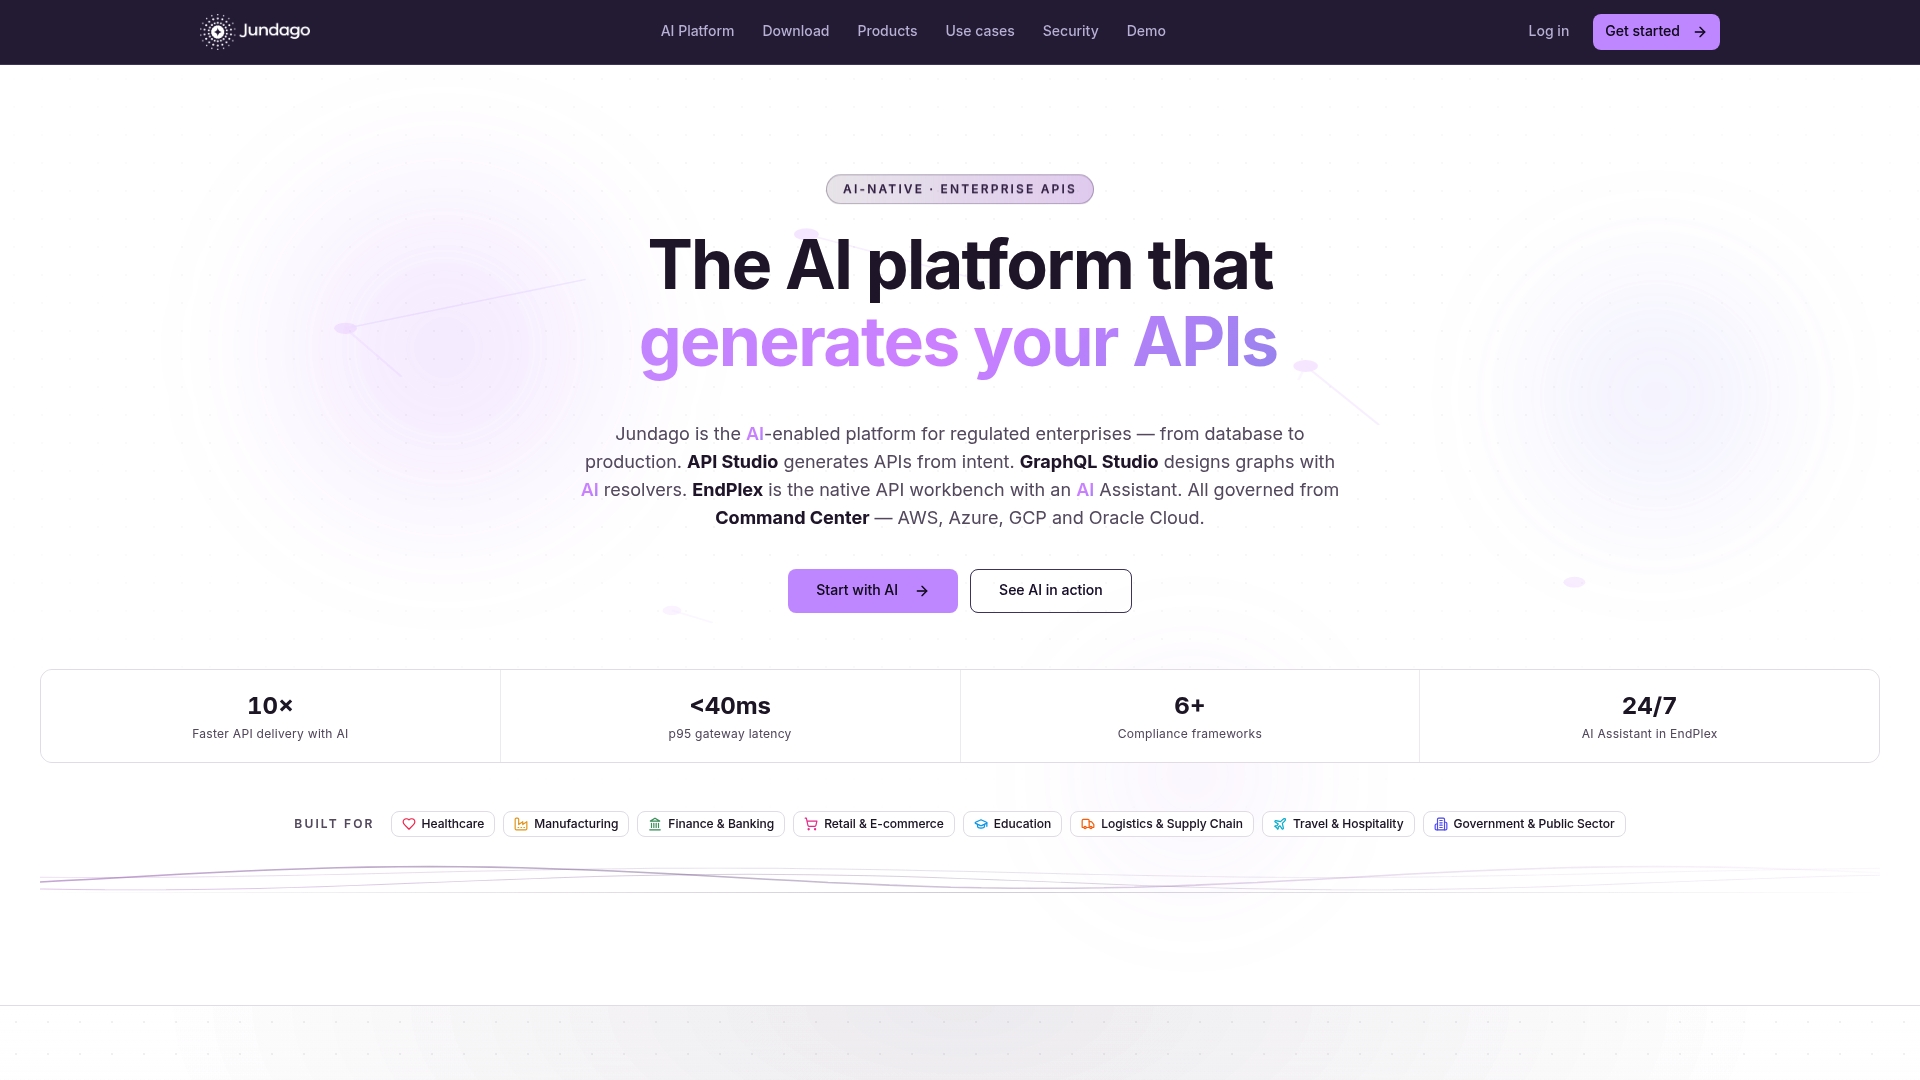
Jundago approaches this differently. The platform covers API generation, testing, load testing, and governance in one AI-native suite, with SDK-based masking that strips PII before telemetry leaves your infrastructure. RBAC and ABAC controls are built in, not bolted on. Industry modules for HIPAA, PCI DSS, Open Banking, and IEC 62443 ship with the platform, so your APIs meet compliance requirements from the first deploy rather than the first audit.
For healthcare, finance, and manufacturing teams running on AWS, Azure, GCP, or Oracle Cloud, Jundago handles the full API lifecycle from a single AI-native API platform — with multi-cloud deployment, CI/CD-ready monitoring integration, and contractual SLAs available for enterprise agreements.
If your team is evaluating API monitoring for a regulated environment, the right next step is a demo. See how Jundago’s compliance-first architecture handles your specific protocols and data requirements before you commit to a stack that requires retrofitting.
Useful sources and further reading
The claims in this article draw on product documentation, practitioner insights, and platform feature pages. The sources below back specific claims and are worth reviewing directly if you want to validate capabilities before a vendor evaluation.
- G2 — Datadog Reviews — practitioner reviews backing Datadog’s integration depth and dashboard capabilities.
- G2 — New Relic Reviews — practitioner reviews backing New Relic’s free tier value and unified telemetry platform.
- G2 — Splunk Enterprise Reviews — enterprise reviews backing Splunk’s compliance reporting and log search power.
- Jundago — primary reference for Jundago’s AI-native API lifecycle platform, compliance modules, and enterprise deployment options.