Best API Load Testing Tools for 2026: A Practical Guide
Best API Load Testing Tools for 2026: A Practical Guide

For regulated enterprise API programs, the clearest path is an integrated platform that covers generation, testing, and governance in one place — Jundago is built for exactly that. For smaller teams or CI-focused workflows, a scriptable open-source framework or lightweight CLI utility usually gets you further, faster.
Here is the shortlist by category:
- Integrated enterprise platform (Jundago): Built-in load testing, RBAC/ABAC, audit logs, and multi-cloud deployment. Best for regulated industries where compliance evidence matters as much as throughput numbers.
- Open-source scriptable frameworks (Apache JMeter, k6, Gatling, Locust): Low license cost, strong CI/CD hooks, language-native scripting. Best for developer-led teams with the bandwidth to own infrastructure and maintenance.
- Managed cloud platforms (BlazeMeter, LoadRunner/OpenText): Global distributed generators, long-term result retention, enterprise SLAs. Best for large-scale tests where you want someone else managing the execution infrastructure.
- Lightweight CLI utilities (Artillery, stresskit): Minimal setup, fast local baselines, JSON/CSV export. Best for quick sanity checks before committing to a full distributed run.
Pro Tip: Before comparing tools on paper, run a 10–15 minute sanity load test in each finalist. Measure p95 latency, throughput (requests per second), error rate, and one infrastructure signal (CPU or memory). The tool that gives you those four numbers with the least friction is usually the right one for your team’s daily workflow.
Key Takeaways
The clearest rule across all the tools covered: match the tool to the team’s language, compliance requirements, and CI/CD cadence before evaluating any feature list.
| Point | Details |
|---|---|
| Regulated programs need integrated platforms | Open-source tools lack built-in audit logs, RBAC, and compliance evidence retention by default. |
| Match scripting language to your team’s stack | Language mismatch is the leading cause of test-suite abandonment within two release cycles. |
| Estimate full TCO before committing | Hidden costs include distributed infrastructure, data egress, support tiers, and maintenance engineering time. |
| CI gates need programmable thresholds | Tools without threshold-based pass/fail checks cannot enforce performance standards automatically in a pipeline. |
| Jundago covers the full regulated lifecycle | API generation, load testing, governance, and multi-cloud deployment under one governed Command Center. |
Table of Contents
- Which API load testing tools should you compare first?
- Open-source API load testing frameworks: what each approach actually costs you
- What managed platforms add and what they actually cost
- How to choose the right API load testing tool for your team
- Why regulated enterprises need an integrated API platform with built-in load testing
- How we evaluated these tool categories
- What most teams get wrong when selecting a load testing tool
- Jundago: built for regulated API programs that need more than a load testing tool
- Sources
Which API load testing tools should you compare first?
The performance testing tools market spans everything from zero-license open-source frameworks to six-figure enterprise contracts, and buyer needs drive the choice far more than feature checklists do. The table below maps the tools covered in this guide across the dimensions that actually narrow the field.
You are critically reviewing LanguageTool suggestions for a English passage.
For each suggestion below, decide whether it is a REAL error in context. Apply a suggestion ONLY when you are confident it fixes a genuine typo, grammar, agreement, or punctuation mistake.
Do NOT apply a suggestion when:
- It capitalizes an ordinary word mid-sentence (LanguageTool often mistakes verbs/nouns for proper names, e.g. “mark” → “Mark” in “assess and mark damaged boards”)
- It changes specialized/domain vocabulary that is already correct
- It alters meaning, tone, or wording beyond the specific error
- You are unsure — leave the original wording unchanged
Minimum changes only. If no suggestion should be applied, return the passage unchanged. Return ONLY the passage (corrected or original).js teams, quick API tests | Free (OSS); Artillery Pro paid | YAML + JavaScript | HTTP, WebSocket, Socket.io | Local / Artillery Cloud | CLI-first, GitHub Actions | JSON, HTML, CloudWatch | Plugin system | | BlazeMeter | JMeter users needing cloud scale | Subscription (usage-based tiers) | JMeter, Gatling, k6, Selenium | HTTP, WebSocket, SOAP | Cloud / hybrid | Global distributed generators | Real-time dashboards, long-term retention | JMeter-compatible, Perforce ecosystem | | LoadRunner (OpenText) | Enterprise multi-protocol, regulated | Commercial license / subscription | C-based scripting, GUI recorder | HTTP, SAP, Citrix, JDBC, MQ, more | Local / cloud / hybrid | CI plugins, ALM integration | Detailed analytics, SLA tracking | Broad protocol library | | Tricentis NeoLoad | Enterprise DevOps, SAP/Citrix | Commercial subscription | GUI + code (Python, JS) | HTTP, SAP, Citrix, WebSocket | Local / cloud / hybrid | CI/CD pipeline integration | Real-time, SLA-based reporting | SAP, Salesforce connectors |
A few pricing notes worth flagging: JMeter, k6, Gatling, and Locust carry zero license cost, but distributed execution infrastructure (cloud VMs, load generators, result storage) adds real operational expense. Managed platforms like BlazeMeter introduce per-virtual-user or per-test billing plus potential data egress charges. Enterprise tools like LoadRunner and NeoLoad typically require a commercial agreement with support and consulting add-ons that push total cost of ownership well above the base license.
Open-source API load testing frameworks: what each approach actually costs you
Load testing covers four distinct patterns: load (expected traffic), stress (beyond capacity), spike (sudden surge), and soak (sustained duration). Each open-source family handles these differently, and the hidden costs vary just as much as the feature sets.

Java-based, broad-protocol frameworks (Apache JMeter)
Apache JMeter is the most protocol-complete open-source option available. HTTP, REST, SOAP, FTP, JDBC, JMS, SMTP, and TCP are all supported natively, with a GUI test IDE for building plans and a headless CLI mode for pipeline execution. The thread-per-user concurrency model works well up to a few thousand virtual users on a single machine; beyond that, you need a distributed controller/worker setup that you build and maintain yourself.
The learning curve is real. JMeter’s XML-based test plans are verbose and can become hard to version-control cleanly. Teams that invest in JSR223 scripting (Groovy is the practical choice) get much more flexibility, but that is a second skill to acquire. Practical comparisons consistently show JMeter chosen for zero-license flexibility, while teams that need managed scale or broader enterprise protocol support eventually move to commercial options.
- Strengths: Protocol breadth, massive plugin ecosystem, no license cost, GUI for non-coders
- Weaknesses: Thread-per-user model is memory-heavy at scale; XML plans are painful to diff; distributed setup is DIY
Go engine with JavaScript tests (k6)
k6 takes a different philosophy: tests are JavaScript or TypeScript files, the engine is Go (so it is memory-efficient), and the CLI is designed for CI from day one. Threshold-based pass/fail checks mean you can gate a pipeline on p95 latency or error rate without post-processing scripts. HTTP/1.1, HTTP/2, WebSocket, and gRPC are all supported.
The shift-left argument for k6 is strong. A developer who already writes JavaScript can author a meaningful load test in under an hour. The xk6 extension system covers additional protocols and output backends. k6 Cloud adds managed distributed execution and long-term storage, but the open-source CLI is genuinely useful on its own.
- Strengths: Developer-friendly, CI-native, efficient concurrency, strong community
- Weaknesses: No GUI recorder; browser testing requires a separate extension; advanced scenarios need JavaScript fluency
Scala/actor-based high-performance engines (Gatling)
Gatling’s actor-based architecture handles very high concurrency with low resource overhead compared to thread-per-user models. Tests are written in Scala (or Java/Kotlin in recent versions), which gives teams a type-safe, code-reviewable test suite. The open-source version produces clean HTML reports; Gatling Enterprise adds cloud execution and centralized dashboards.
The honest caveat: Scala is a niche language in most QA teams. If your engineers are not already Scala-fluent, the onboarding cost is significant. Gatling’s plugin ecosystem is also narrower than JMeter’s.
- Strengths: Excellent concurrency efficiency, code-as-test, strong HTTP/WebSocket support
- Weaknesses: Scala learning curve, smaller ecosystem, limited protocol breadth vs JMeter
Python-based event-driven frameworks (Locust)
Locust uses Python coroutines (via gevent) to simulate users, which means your test scenarios are plain Python classes. For teams already writing Python, this is the lowest-friction entry point. The built-in web UI gives real-time charts during a run, and horizontal scaling across multiple workers is straightforward.
Protocol support beyond HTTP requires custom clients, which is a real limitation for teams testing gRPC or message-queue APIs. Governance features are absent by design.
- Strengths: Python-native, easy to read and maintain, good web UI, horizontal scaling
- Weaknesses: HTTP-centric by default; no built-in compliance features; custom protocol support requires extra code
Node.js-based toolkits (Artillery)
Artillery uses YAML for scenario definition with JavaScript hooks for custom logic, which makes it readable for teams that want test plans that non-engineers can review. HTTP, WebSocket, and Socket.io are supported out of the box. The CLI is clean, and GitHub Actions integration is straightforward.
Artillery Pro and Artillery Cloud add distributed execution and dashboards, but the open-source version is genuinely capable for API regression and spike tests.
- Strengths: YAML-readable scenarios, fast setup, good WebSocket support, CI-friendly
- Weaknesses: Less mature than JMeter or k6 for very large-scale runs; smaller ecosystem
Lightweight CLI utilities (stresskit and similar)
For fast local baselines before a full distributed run, lightweight CLI tools are underrated. A tool like stresskit uses asyncio and aiohttp to fire requests, then outputs color-coded terminal results with latency histograms, sparkline throughput, and exportable JSON/CSV. Setup is a pip install. These tools trade governance and protocol breadth for zero friction, and that trade is worth it when you need a quick regression check before pushing to staging.
- Strengths: Near-zero setup, readable output, exportable results, great for developer baselines
- Weaknesses: No distributed execution, no enterprise features, limited protocol support
Pro Tip: Match the scripting language to your team’s primary stack. Canonical buyer guides consistently show that language mismatch is the single biggest driver of test-suite abandonment. Python teams drift toward Locust; JavaScript teams stay with k6; Java shops default to JMeter.
What managed platforms add and what they actually cost
Managed platforms solve a specific problem: running thousands of concurrent virtual users from geographically distributed generators without owning the infrastructure. That is a real operational burden for open-source stacks, and managed platforms absorb it in exchange for a recurring fee.
What you get with a managed platform:
- Global distributed load generators with no VM provisioning on your side
- Browser and API testing combined in a single execution environment
- Long-term result retention for audit and trend analysis
- Centralized dashboards with real-time percentile tracking
- Enterprise SLAs, SOC 2 / ISO 27001 attestations, and dedicated support
BlazeMeter (now under the Perforce portfolio) is the most common entry point for teams already using JMeter. It accepts JMeter, Gatling, k6, and Selenium scripts and executes them at cloud scale with a distributed generator network. Pricing follows subscription tiers with per-virtual-user or per-test billing; data egress charges apply for large result sets. The BlazeMeter platform is best understood as a managed execution layer on top of familiar open-source test formats.
LoadRunner (OpenText/Perforce) covers the widest enterprise protocol range: SAP, Citrix, JDBC, MQ, and more alongside HTTP. It is the default choice in organizations where regulated system testing spans legacy middleware, not just REST APIs. Commercial licensing and consulting add-ons push TCO high, but the protocol coverage and SLA-backed support justify it for certain enterprise contexts.
Tricentis NeoLoad targets DevOps-oriented enterprise teams with SAP and Salesforce connectors, CI/CD pipeline integration, and SLA-based reporting. It sits between LoadRunner’s breadth and k6’s developer ergonomics.
Managed platform TCO considerations:
- Base subscription plus per-VU or per-test overage charges
- Data egress fees for large result exports or long-term storage
- Enterprise support tiers (often a separate line item)
- Onboarding and professional services for complex protocol setups
- Potential lock-in to proprietary script formats
The honest trade-off: managed platforms reduce operational overhead for large-scale tests but introduce recurring costs and potential egress charges that compound quickly at scale. Estimate the full TCO before signing, not after.
How to choose the right API load testing tool for your team
The decision is not about which tool has the longest feature list. It is about which tool your team will actually maintain six months from now.
Decision checklist:
- Define the goal. Is this a CI gate (fast, threshold-based, runs on every PR) or a full-scale stress test (thousands of VUs, distributed, pre-production)? These require different tools.
- Identify who owns the tests. Developers owning CI tests need a code-native tool. A dedicated QA team running quarterly load tests can absorb a GUI-based tool with more setup.
- Choose your metrics and thresholds first. Decide on p95 latency, throughput, and error rate targets before picking a tool. A tool that cannot enforce programmable thresholds in CI is a red flag.
- Plan distributed infrastructure. For open-source tools, distributed execution means VMs, a controller, and result aggregation. Price that before assuming “free” means cheap.
- Estimate total cost of ownership. License cost plus infrastructure plus engineering time to maintain test suites plus support. For regulated teams, add compliance evidence generation and audit log retention.
Questions to ask vendors and internal stakeholders:
- What are the concurrency limits at each pricing tier?
- Does the tool produce audit-ready logs and role-based access controls?
- What are the network egress charges for large result sets?
- What is the SLA for support, and does it cover production incidents?
- How does the tool handle data retention for compliance reviews?
Red flags to watch for:
- Opaque per-VU pricing with no published ceiling
- No programmable pass/fail thresholds for CI integration
- Limited protocol support (HTTP-only for a team testing gRPC or SOAP)
- No audit logs or RBAC for regulated environments
- Vendor lock-in to proprietary script formats with no export path
Match by use case:
- Dev-led CI regression: k6 or Artillery with threshold-based gates
- Staging full-scale stress: JMeter distributed or a managed platform
- Browser + API end-to-end: Managed platform with combined execution
- Regulated production acceptance: Integrated platform with built-in governance (Jundago)
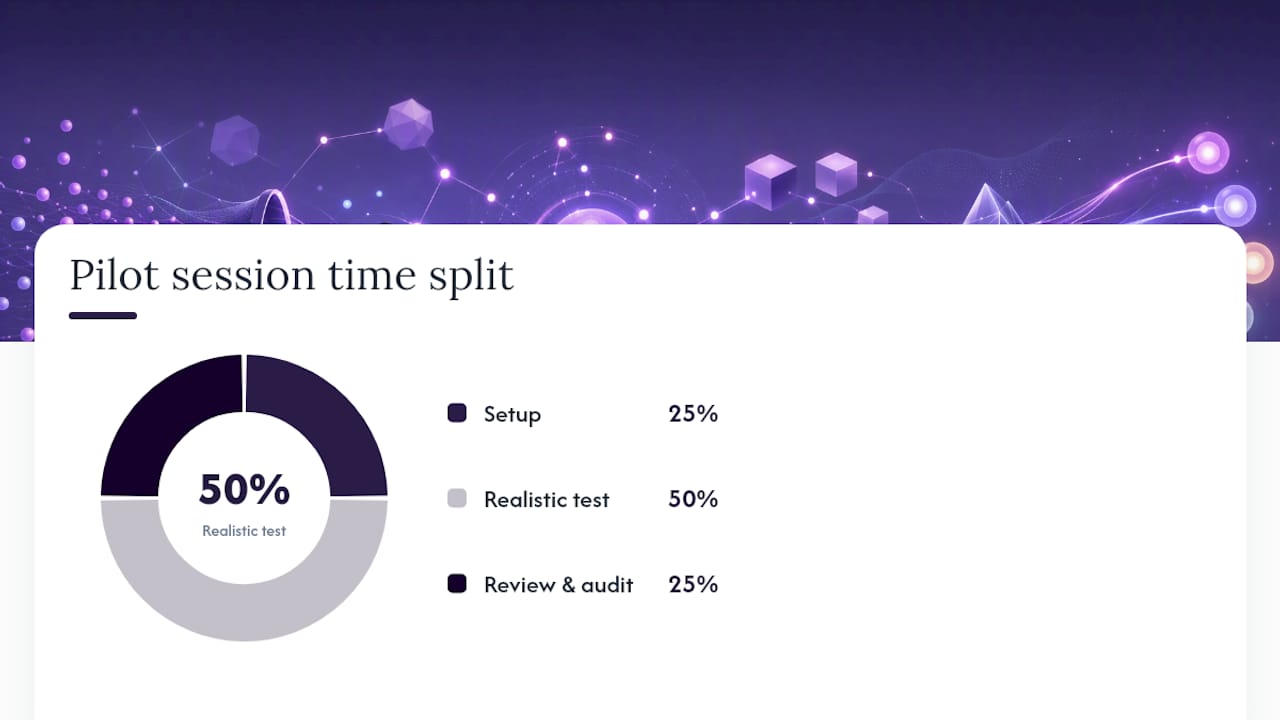
Pro Tip: Split a 2-hour pilot into three blocks: 30 minutes on setup and first test run, 60 minutes on a realistic scenario with your actual API endpoints, and 30 minutes reviewing the metrics output and asking “could I hand this report to an auditor?” That last question eliminates most open-source tools for regulated programs immediately.
Why regulated enterprises need an integrated API platform with built-in load testing
Stitching together a load testing tool, a governance layer, an audit log system, and a compliance reporting workflow from separate point tools is not just operationally expensive. It creates evidence gaps that auditors find.
For teams operating under HIPAA, PCI DSS, or similar frameworks, the testing artifacts are part of the compliance record. That means test configurations, execution logs, result data, and change approvals need to be traceable, role-restricted, and retained. Open-source tools do not provide this by default, and adding it post-hoc usually means custom tooling that itself needs to be validated.
What an integrated platform provides for regulated workflows:
- Centralized test artifact storage with version history
- RBAC and ABAC controls so only authorized roles can modify or execute tests
- Audit logs that capture who ran what, when, and with what configuration
- Encrypted test data handling for APIs that touch PII or financial records
- Compliance-module alignment (HIPAA, PCI DSS, Open Banking) built into the platform rather than bolted on
Regulated release cycles require performance validation as part of change control. An integrated platform that ties load test results directly to the API version under review, with a traceable approval chain, turns a manual documentation burden into an automated artifact. That is the difference between a compliance checkbox and a defensible audit trail.
Jundago covers this end-to-end: API generation, load testing, governance, and multi-cloud deployment (AWS, Azure, GCP, Oracle Cloud) under a single Command Center with RBAC/ABAC and compliance modules for healthcare, finance, and manufacturing. Teams in those sectors do not need to assemble a toolchain. The Jundago platform is designed so that the API you generate, test, and deploy carries its compliance evidence with it from the start.
Industry reports on DevOps and AI in testing consistently flag that choosing the wrong performance testing tool increases technical risk, and that integrating load testing into CI/CD with tools matched to team skillsets is the clearest mitigation.
How we evaluated these tool categories
Evaluation axes used:
- Scalability and concurrency model (thread-per-user vs coroutine vs actor-based)
- Scripting ergonomics and language match to common team stacks
- CI/CD friendliness (CLI support, threshold-based pass/fail, pipeline integrations)
- Protocol support breadth (HTTP, gRPC, WebSocket, SOAP, JDBC, and others)
- Reporting and metrics quality (percentile visibility, real-time dashboards, exportability)
- Enterprise features (RBAC, audit logs, SLA-backed support, compliance attestations)
- Total cost of ownership including hidden infrastructure and support costs
Synthesis sources: Gartner market reviews, canonical project documentation (JMeter, k6, Gatling, Locust), vendor portal content treated as descriptive rather than independent validation, and independent comparative guides from the performance testing community.
Test heuristics applied: Sanity load (baseline at expected traffic), stress (ramp beyond capacity), spike (sudden surge and recovery), and soak (sustained duration for memory and connection leak detection).
Conflict of interest disclosure: Jundago publishes this article and competes in the integrated API platform category. The article favors integrated platforms for regulated programs because the evidence supports that recommendation, not solely because of publisher interest. Readers should pilot tools against their own API endpoints and compliance requirements before committing.
Quick validation checklist for a 1–2 hour trial:
- Run a baseline load test at expected peak traffic and record p95, throughput, and error rate
- Ramp to 2x expected load and note where errors first appear
- Check whether the tool produces a report you could attach to a change control ticket
- Verify CI integration works end-to-end (trigger from a pipeline, get a pass/fail result)
What most teams get wrong when selecting a load testing tool
The most common mistake is choosing a tool based on a demo, not a pilot. A polished dashboard in a vendor walkthrough tells you nothing about how the tool behaves when your actual API endpoints are under 500 concurrent users with realistic payload sizes and auth headers.
The second mistake is underestimating maintenance. An open-source test suite that nobody owns becomes stale within two release cycles. If the team that built the JMeter plan leaves, the institutional knowledge goes with them. This is especially painful in regulated environments where test artifacts need to be reproducible and explainable months later.
For a regulated rollout, the shift that actually changes outcomes is treating load test results as compliance artifacts from day one, not as developer metrics that get discarded after a release. When a team running a healthcare API integration started capturing test configurations, execution logs, and result summaries in a governed repository tied to each API version, their change control reviews went from multi-day back-and-forth to same-day approvals. The auditors had everything they needed in one place.
Practical rules for your first two tests:
- Test 1: Baseline at expected peak. Measure p95 latency, throughput, and error rate. Set these as your CI gate thresholds.
- Test 2: Stress to 2x peak. Find the failure point. Document it. That number belongs in your capacity planning record and your change control evidence.
Everything else is useful context, not a gate.
Jundago: built for regulated API programs that need more than a load testing tool
Most teams reading this article are choosing between assembling a toolchain and buying a platform. If your APIs touch regulated data — healthcare records, financial transactions, manufacturing control systems — the assembly cost is higher than it looks on a spreadsheet.
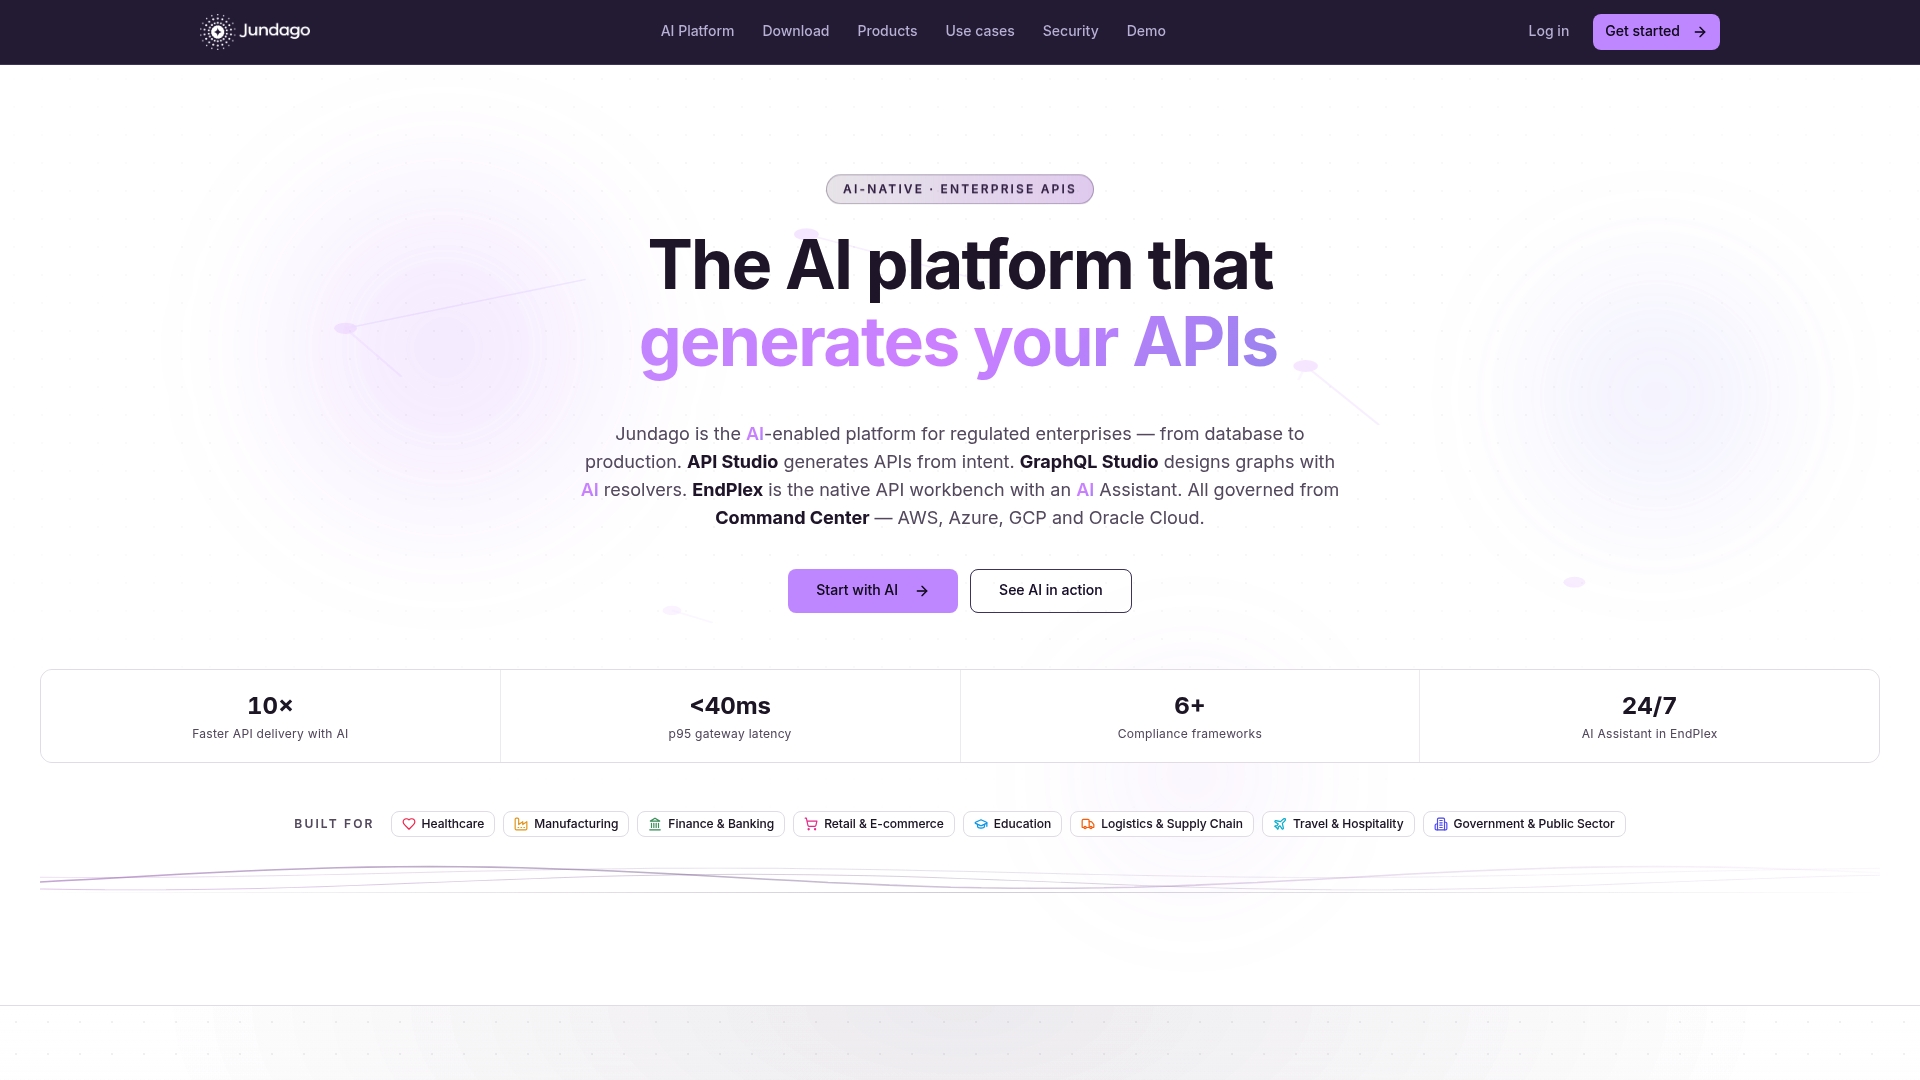
Jundago is the integrated alternative: AI-native API generation, built-in load testing, RBAC/ABAC governance, and compliance modules for HIPAA, PCI DSS, and Open Banking, all deployed across AWS, Azure, GCP, and Oracle Cloud from a single Command Center. You do not wire together a load tester, an audit log system, and a governance layer. They ship together, already connected.
The concrete difference for regulated teams: every test run produces a traceable artifact tied to the API version under review, with role-restricted access and retention built in. That is what turns a performance test into compliance evidence.
Jundago to see how the platform handles your specific regulatory requirements.
Sources
- Best Performance Testing Tools Reviews 2026
- Load testing - Wikipedia
- stresskit
- Top Performance Testing Tools Compared: JMeter, LoadRunner & More
- Top 10 Performance Testing Tools in 2026 | BrowserStack